Introduction to the Company
Meituan sells goods and services in the O2O sphere in China, providing users with the ability to order food and goods, as well as book hotels, tickets, and restaurants. In fact, Meituan operates as a super-application that includes several business segments depending on the user’s specific need. Meituan was founded in 2003 in Beijing as a group shopping marketplace and began to grow by 2014 (Acquired, 2021). One of the unique characteristics of this company that qualitatively sets it apart from its competitors is the active implementation of innovative technologies that contribute to Meituan’s digital development. It is reported that the company is already practicing the use of autonomous drones and the development of a feature-rich mobile super app for consumer use, as well as investing in the use of artificial intelligence to personalize consumer offerings and optimize delivery systems more deeply (Meituan, 2019a; Wu, 2019). In addition, the company is also benefiting from the active mergers with other large enterprises that Meituan has practiced over the past decade. Some of the biggest deals include mergers with Chinese IT aggregator Dianping Software Manufacturing and Sales, online food delivery platform Tencent, and bike rental business Mobike (Meituan, 2018a; MERGR, 2015). The company has values associated with its business, which include honesty, the pursuit of mutually beneficial partnerships and excellence, and customer focus (Meituan, 2022). Thus, the company’s current main development path is to invest in technology and increase its investment appeal by creating an intelligent brand that meets the basic needs of its customers.
The Company’s services are highly diversified and include ticket and coupon sales, food delivery and hotel reservations, bicycle rentals, and online search engine services like Google. Meituan’s business model includes customers, salespeople, and delivery drivers as key figures (ELLUMINATI, 2022). Customers who want door-to-door delivery and a single super-application for shopping, including the purchase of basic necessities, are given virtually hassle-free options through the 美团外卖 (“Meituan Takeaway”) app. Vendors, in turn, get the opportunity to sell their goods and services on the Company’s platform, and Meituan’s broad customer base increases the opportunity for companies to multiply profits by attracting new customers. Suppliers, in this case, are not only small and medium-sized businesses that sell goods on Meituan’s intelligent delivery systems but also hotels, taxi companies, restaurants, museums and cinemas, airlines, and other lifestyle businesses that are interested in increasing sales through the company. In fact, it is a B2B partnership in which private merchants and companies who place on the platform pay commissions. The third facet of the Meituan business model triangle is the drivers and couriers who provide the link between vendors and customers. The company’s primary sources of profit, other than commissions from suppliers because they function as an intermediary, are the advertising placed in the app.
Segment analysis allows us to identify the critical areas of business that bring the Company the most profit. In terms of business segmentation, Meituan’s primary revenue (in millions) in 2021 was for food delivery (CNY 96,311.8) versus CNY 32,530.3 for the store, hotel, and travel segment and CNY 50,285.9 for the new initiatives segment, including innovative technology, according to the company’s annual report (Table 1) (Meituan, 2021). In terms of geographic segmentation, 100% of revenue (179,128.0 CNY) was generated by the Company from the People’s Republic of China, as this is the only area that provides customer service. The share of the food delivery segment has been dynamic over the past six years and has declined markedly since 2017. Meanwhile, the five-year trend shows that Food Delivery is still a key profit-generating trend.

Meituan’s competitive advantage is its commitment to innovation and technological growth, as well as its high adaptability to market changes. More specifically, at the end of 2021, the company changed its positioning strategy from “Food + Platform” to “Retail + Technology,” which significantly expands its areas of business and creates potential for long-term growth. Specific measures the company has already taken as part of the expansion include increasing the number of physical dark stores, which reduces delivery waiting time, and opening an overseas platform where Chinese customers can buy goods online from abroad (Brown, 2022). Meanwhile, Meituan is not the absolute leader in the competitive market for lifestyle super apps. Figure 1 shows that Meituan occupies an average position, sharing a niche share with competitors such as Didi and JD, but far behind Tmall and Pinduoduo in popularity. Perhaps one of the reasons Meituan is not a niche leader is the serious legal pressure put on the company. Meituan was reportedly heavily fined CNY 3.4 billion in October 2021 for violating antitrust laws (Lee, 2021b). Notably, a few days after that, the company found itself in the middle of a significant backlash, being criticized by the public for its inefficient use of users’ personal data (Lee, 2021b). Among the main factors that prompted government and public condemnation of CNY were coercive vendor exclusivity, pressure on partners, and an unfair system of commissions and fines. In other words, the main anti-competitive problems faced by the company are government and public pressure caused by Meituan policies.

Overview of the Sector
Meituan has a strong position in O2O, holding up to 65% or 67.3% depending on the source (Figure 2) of China’s food delivery market share by 2020, with China itself holding 45.9% of the global market share of this industry (Jun, 2020). Since Meituan engages in the sale of goods and services and the e-commerce industry, it is obviously worth paying attention to this statistic. The data reports that China’s e-commerce market is projected to grow 18.9% to $2.5 billion over the next five years (IBIS, 2022). The societal agenda raised by COVID-19 and the severe social constraints that continue to this day are forcing tens of millions of Chinese to use O2O platforms to stay at home and get goods and products to their homes (Yang et al., 2021). This is fully in line with the megatrend noted by McKinsey and Company describing the deep digitalization of services, supply chains, and retailing in China (Bu et al., 2021). O2O ecosystems continue to grow strongly in the Chinese market, which is already the absolute leader in e-commerce and in the number of active users, as shown in Figure 3. As mentioned above, the Company’s primary sources of revenue in the business segment are food delivery, which brought the company up to 54% of its total revenue in 2021. In terms of geographic segmentation, Meituan is only present in mainland China so that the sector review will use the local market exclusively. This review will look at the critical macroeconomic forces and trends affecting the food delivery sector and China as a whole.


Mainland China: Demographic, Economic, and Technological Patterns
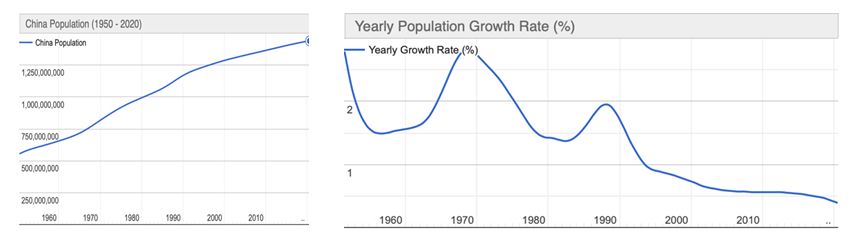
China’s economy has been undergoing low growth since the pandemic, under severe external pressure. China is still the most populous area of the world, with 1.451 billion people by 2022. Given the trends of the past 60 years, this figure is expected to continue to grow for some time, but it is worth bearing in mind that the average annual rate of population growth has been falling rapidly in China since 1988, as shown in Figure 4. This implies that the number of service consumers will continue to grow over the next few years, which means that local companies need to increase their supply to meet demand optimally.
It is worth specifying that China is not the center of technological development in the world, but it is actively making efforts to lead in this niche. In the ranking of the world’s most high-tech countries, China ranks only third (WPR, 2022). Meanwhile, China’s leading position in terms of technological development is reasonable: it is here that the e-commerce and O2O industry has been actively developing in recent years. It is reported that China is a pioneer in this industry, especially when it comes to e-commerce from a cell phone, as the volume of online purchases made in the country accounts for up to 80% of transactions made from a phone, while the global figure is 64% (China Ecommerce, 2022). It is expected that the number of active users of virtual platforms in the country will continue to grow and is expected to reach 1.279 billion users by 2026, almost 20% more than the current figure (Thomala, 2021). In this context, it is impossible to ignore one of the most severe driving forces that have impacted the e-commerce market in China, namely the COVID-19 pandemic. The pandemic itself did not do as much damage to China as the restrictions and barriers that emerged during attempts to contain the adverse effects of COVID-19 did. Restrictions related to social isolation and the need to stay and work at home could not help but affect e-commerce trends — consumer behavior showed a significant shift toward online shopping. For example, for mainland China, between 2018 and 2020, online retailing increased by $353.9 billion, while physical stores suffered a $74 billion decline (UNCTAD, 2021). In other words, the inability to buy goods online, fear for one’s own safety, and government restrictions that harden over time have caused the Chinese e-commerce industry to surge, strengthening the country’s position on the global leaderboard.
The demographic and health patterns affecting market structure cannot be viewed in isolation from macroeconomic trends specific to China. Notably, even amid the constraints of COVID-19, China’s GDP has continued to grow over the past five years. According to the NBS, China’s GDP will reach the CNY 114.4 billion mark by 2021, surpassing last year’s figure by 8.1% (Zhou, 2022). However, according to the World Bank, the sharp growth seen in 2021 is projected to slow down in 2022; as a result, GDP growth will fall to 5.1% by the end of this year (WBG, 2021). The World Bank cites geopolitical unrest and mainland Chinese government policy of deleveraging, as well as renewed waves of COVID-19, as the main reasons for lower economic growth.
China’s current macroeconomic vectors are aimed at reducing market risks by taking private companies under state care, as well as relaxing taxation policies. Xi Jinping’s program of state regulation of borrowing, investment, and export strengthening, launched back in 2016, is showing intermediate results, while China still faces rising labor costs, heavy reliance on foreign investment, and deficits (CRS, 2022). Additional challenges, including those affecting the Chinese government’s ability to achieve modeled economic growth in 2022, include the Russian invasion of Ukraine and provocations from the United States, which are causing a global recession in the global economy with rising inflation (CRS, 2022; Ozili, 2022). As a result of such events, local private companies are experiencing shortages, leading to massive cuts, including for Alibaba, which in the summer of 2022 came to the decision to lay off 9,241 employees to reduce operating costs (Cao, 2022). Thus, by now, China is in a positive phase of economic growth but is severely constrained by both the national government and the geopolitical agenda, resulting in lower net revenue and challenges that the Company will have to contend with after the pandemic.
Food Delivery Sector
The food delivery industry has undergone significant growth in recent years and is projected to grow further over the next five years. The food delivery market, a pioneer in the global ranking, is driven by the reasons already mentioned: the impact of the pandemic, population growth and the technologicalization of services, as well as active urbanization and the rejuvenation of the average consumer. This segment is expected to grow to 941.74 billion CNY in 2022 (中商产业研究院, 2022). In terms of longer-term planning, growth is also expected over the next five years, bringing the market to CNY1407.21 billion by 2027 with an average annual increase of 5.95%. Against the backdrop of strengthening positions, there is also a dramatic increase in the segment’s penetration into the consumer community, as shown in Figure 5. In other words, users have increasingly turned to food delivery services in the last two years. Interestingly, it is P2C (Platform-to-Consumer) that plays a decisive role in the development of this market, as opposed to direct delivery to customers from restaurants, as shown in Figure 6.


The growth of the P2C food delivery industry is primarily driven by increased user activity in the local community. It is reported that about one in seven users in China order food delivery up to 20 times a month, or almost every weekday, with about a third of all users ordering food up to six times a month (干货收割机, 2022). The target audience of consumers of these services is predominantly white-collar or office workers, who made up to 83% of customers by 2022, with only 10% of students (Han & Law, 2018). To put it another way, P2C consumers are mostly paying customers, which is driving this industry’s growth. The pricing policies of food delivery platforms also appear to be more loyal than Western practices: average prices are about 20% lower than US offerings, which also appears to be a predictor of segment growth (Luo, 2021). Lower prices and more advanced coordination are also influenced by fierce competition in markets, especially in the major cities of Shanghai and Beijing, which lowers the equilibrium market price for the service.
In the context of the macroeconomic and political trends of the Chinese agenda, it is critical to discuss the policy of containment of technology companies initiated by Xi Jinping. The “crackdown,” as Bloomberg experts call it, on IT companies, including Meituan, is justified by the Chinese government’s desire to control the digital economy and residents’ data (Liu et al., 2022). There are also ideological reasons for the development of Marxism and socialism in the country, contrary to the current situation of unequal distribution of resources and capital. Increased provocations and conflicts in U.S.-China relations also play a role in developing complications for private businesses in China (Singh, 2019). The commercial and technological growth of tycoons, including Meituan, finds itself significantly stymied by government initiatives and frequent antitrust inspections, potentially affecting the company’s operations. Increased inspections of businesses result in heavy fines due to antitrust violations and lead to the suspension or stalling of operations. As a result of such regulations, companies incur higher costs to pay off debts, and the risk of falling sales by reducing the reputation of the brand in the perception of consumers as undesirable to Chinese society of a private company increases.
Competition in the P2C Food Delivery Market
The local food delivery industry is predominantly a dual market, dominated by two equal players: Meituan (from Tencent) and Ele.me (from Alibaba). It is these two companies that account for up to 95% of all orders placed by Chinese users (Lingling, 2022). It follows that, firstly, although the segment is represented by other companies such as ENJOY, Daojia, Home-cook, they do not have such a thorough influence on the industry. Secondly, the competitive dualism in O2O field is unlikely to end in the coming years, so the company must seek new ways to profit in less stressful markets. From this follows two strategies that Meituan is currently pursuing as part of its competitive advantage.
From the first paradigm of direct competition with Ele.me, Meituan is interested in increasing its customer base in major cities by providing more favorable terms of use for the super app. For this reason, Meituan is actively investing in brand awareness, including through innovative tactics like the use of drones for food delivery (Meituan, 2019a). Meituan’s competitive differences from Ele.me also include offering great discounts, ordering corporate meals at favorable terms, and targeting the white-collar segment, as opposed to the students who represent Ele.me’s consumer core (Han & Law, 2018). That said, Meituan provides less favorable terms for suppliers (restaurants, dark stores) because the commission rate is higher than Ele.me’s: 18% vs. 15%. The higher rate can be justified by the higher number of suppliers: more than 2.11 million restaurants were registered on Meituan by early 2020, as opposed to 0.87 for Ele.me (Blazyte, 2022). At the same time, Meituan had 691 million active users at the end of 2021, as opposed to 40 million users for Ele.me (Smith, 2022; CIW, 2022). In simple terms, greater internal competition on the Meituan platform creates some attraction for vendors because more users already use the platform — consequently, vendors are willing to pay more commissions to have access to a ready-made user base.
On the other hand, competition in this industry is realized, including for the occupation of market niches that are traditionally less densely populated. Five regions in mainland China (Guangdong, Shandong, Henan, Jiangsu, and Sichuan) account for up to a third of the country’s total population (Textor, 2022). Consequently, these markets are highly oversupplied, so the appropriate strategy is to look for new niches that are not as densely populated or technologically saturated as the first-tier cities. Developing delivery systems in such cities and areas of mainland China will be a winning strategy for the pioneer company, as it will increase the customer base without fierce competition and will take over this niche for itself for a while competitors prepare to enter this market.
Thus, competition in the O2O food delivery market in China is fierce, mainly due to dualistic leadership. The mutual struggle between Ele.me and Meituan, which have a long-term relationship, affects the inability of either competitor to be at the top of the market and thus multiply their profits. Consequently, companies must look for new ways to expand their influence, which includes both expanding niche markets and developing customer loyalty. Demand for food delivery in China is expected to continue its steady growth due to the increasing population and digitalization of the service industry, as well as the rejuvenation of the average consumer.
Company Assessment
Information on the Company’s financial performance over the past six years (2015-2021) was obtained from S&P Capital IQ and verified in Meituan’s annual financial reports. This information was used to evaluate Meituan’s commercial development in both past years and projections for future reporting periods. However, a pure comparison within a single Company does not make sense, as it does not allow for an assessment of brand sustainability; instead, a comprehensive assessment of the O2O food delivery sector and the inherent dynamics of competitors is proposed.
A Brief Analysis of the Sector’s Competitors
In addition to the already mentioned Ele.me as a subsidiary of Alibaba, Meituan’s competitors also include Pinduoduo and Dada Nexus. Ele.me was founded in 2008 as an online food delivery platform and was taken over by the Alibaba Group in 2018; despite the merger, Ele.me continues to operate independently as a subsidiary. That said, like Meituan, Ele.me is entirely focused on mobile users and electronic payment processing, so customers can place orders from anywhere in the service areas. As the results of the sociological survey show (Table 4), it is the delivery characteristics (speed, quality) that primarily determine the financial success of the brand, as these are the aspects most expected by consumers. Ele.me takes advantage of this, as over the past few years the company has begun a partnership with Ali Cloud, a transportation chain coordination and development company, using artificial intelligence (Cissy, 2017). This has allowed Ele.me to tune its own courier service and use resources more intelligently to reduce wait times, a major predictor of success in the ready-to-eat delivery industry more finely. It is reported that every day Ele.me serves more than 1.8 million orders in Beijing, including both R2C delivery and supermarket delivery. Unlike Meituan, Ele.me has not yet filed for an IPO, so it does not publicly disclose its financial performance — for this reason, commercial dynamics will be studied for parent company Alibaba Group, which owns Ele.me.
Pinduoduo is also a purely Chinese company founded in 2015, but unlike Meituan or Ele.me, Pinduoduo distributes farm products, according to S&P Capital IQ. Pinduoduo’s business model is based on direct group purchases from the producer, bypassing the retail sales stages: in this case, customers can save money through lower prices due to wholesale sales, and the producer gets to sell more goods. With this model, users are willing to wait some time (a few days versus an hour for ready-to-eat delivery) because they understand the benefit of this wait: the team for the group purchase must form before the order takes effect. Pinduoduo’s competitive advantage has been working with low-level cities, from remote areas, which big players like Ele.me and Meituan have traditionally not paid close attention to; as a result, Pinduoduo has managed to build a base of 100 million active users (Viktor, 2018). Among other things, Pinduoduo has integrated international brands into its system, allowing Chinese users to buy foreign products, such as Apple or Nike, at reduced prices. By now, the company’s main sources of revenue are advertising integrations on mobile platforms, as well as commissions from transactions made through Pinduoduo.
Finally, a competitor in this sector is also Dada Nexus, a Chinese company that sells goods on demand. Dada Nexus, like its direct competitors, does not only deliver food but also door-to-door delivery of retail goods, whether it be flowers, stationery, medicine, toys, or any other goods that consumers can but do not want to buy directly from retail stores, wasting their time. There is a parallel in commitment to technology: Dada Nexus uses artificial intelligence to optimize its coordination operations, reducing the time it takes to deliver goods. In 2019, Dada Nexus was considered the largest marketplace in terms of total orders, but years later it has significantly reduced its leadership position (Dada Nexus Limited, 2020). Thus, Meituan’s three direct competitors, including Ele.me, Pinduoduo and Dada Nexus, each of which operate in China and provide services in the O2O industry, will be used for a thorough competitive analysis.
Table 2: Factors driving customer experience of O2O food delivery service
Direct Comparison: Growth, Shares
An essential but superficial measure of a company’s commercial performance is a retrospective measure of its earnings. A trend toward increasing positive profits signals the right strategic path for the company, in which it earns more than it spends, but period-specific profit dips can be evidence of not only poor operating efficiency but also significant structural changes with positive long-term business implications.
Table 3: Change in company profits over the past six years, 2016 to 2021
As Table 3 shows, the companies have shown quite different rates of profit growth over the study period. Notably, of all competitors, only Ele.me had the most minor earnings variance and showed moderate earnings growth at 45.7% over the six years. The most considerable fluctuations were characteristic of Pinduoduo, which first recorded profit in 2017 (the company launched in 2015), and almost immediately showed a significant profit increase of 652.3% in 2018, after which a sharp decline began (Figure 7). Experts cite a modernized approach to B2C commerce and a qualitative difference from competitors due to extremely high user discounts, among the main reasons for this peak (Lee, 2018). Against this background, Meituan’s profits showed a precipitous drop until the 2020 pandemic caused by the restructuring associated with the takeover of high-value local companies like Mobike (Meituan, 2018a). In addition, it was during this period that Company invested heavily in technology and innovation in consumer services, trying to outperform Ele.me, resulting in a shift in focus from increasing profits to expanding customer markets. According to Meituan’s CFO, “…profitability is not our most important goal in the short term, and we’ll continue to invest in areas such as our restaurant management system and build up our ecosystem for the users and the merchants…” (Deng & He, 2019, para. 2). The way companies have responded to pandemic constraints is also noteworthy. It can be seen from Figure 7 that only Dada Nexus showed an increase in profits, which was largely due to the wide assortment that the company presents to customers choice — being forced to sit in quarantine has led to the development of e-commerce, which has had a natural effect on Dada Nexus’ profit growth. This is due to both a nearly 69% increase in its customer base for 2020 and a nearly 46% increase in the number of orders placed (Dada Nexus Limited, 2021). Interestingly, even in 2021, when the main waves of the pandemic are not yet over and the severity of quarantine measures in China has only increased, Dada Nexus and Pinduoduo showed a 65.6% and 39.5% drop in profits, respectively, while apps focused mainly on ready-made food delivery (Meituan and Ele.me), in contrast, increased this figure by 2021 by 37.3% and 5.4% respectively. In other words, isolated users, already accustomed to pandemic restrictions, saw more sense and benefit in food delivery than in retail food delivery, including self-cooked food.

For the cogency of the conclusions obtained and a deeper look at the commercial efficiency of companies, it is necessary to pay attention to the indicators of net profit, calculated as income minus all expenses. It is indicative that Meituan’s earnings have naturally reflected the Company’s operational decisions related to acquisitions and serious investments — the low end of the Company’s net profit figure was (178.30%), just the year Meituan announced the acquisition of the giant Mobike (Table 4). The company, after nine years at the IPO, finally reached a positive net profit in 2019 and showed robust growth of about 2% a year, but the impact of the pandemic was again in a loss-making phase. The drop in net profit amid the impact of the pandemic may have been due not only to the move of suppliers and courier delivery to autonomous mode and the need to fix broken supply chains for Meituan but also to the public backlash caused by higher commissions and exclusive cooperation rights for suppliers. The Company’s key competitor, Ele.me, once again demonstrated net solid profit dynamics and was never at a loss during the entire reporting period — this testifies to the right strategic decisions being made in the organization and the focus on stable, even if not short-term, growth.
Table 4: Change in companies’ net income over the past six years, 2016 to 2021
Key Performance Comparison
Annual financial reports provide valuable information about the companies’ commercial performance, which gives even more insight into the differences between competitors; DuPont’s analysis was run for comparison. Tables 5-8 show that Ele.me’s ROA is the least volatile, meaning that Alibaba has been the most efficient in using its assets to grow the company’s capital, while Meituan’s ROA has been in a negative phase most of the time (Figure 8). Meituan, compared to the more stable Ele.me, did not effectively manage its return on assets, as evidenced by Meituan’s low net income in the reporting period. The decline in earnings with a minimum defining ROA of -8.3 is due to the company inefficiently spending capital on strategic expansion contrary to profit growth decisions; Meituan is looking at a long-term profitability growth path, so the ROA was not as high in the initial stages of the IPO. Looking at these trends in terms of leverage, for Meituan (Figure 9), we can see that by 2019, ROA showed significant growth, driven by leveraging credit to invest in AI-based delivery systems and automated drones (Meituan, 2019a). Over time, after 2019, return on equity gradually leveled off and fell back to negative values in the post-pandemic period due to the leveraging of additional loan assets (Table 11). Thus, due to the inability to adjust to constraints and the temporary decline in Meituan’s operating efficiency due to its expansion investments, the company suffered net income losses, unlike its competitors, who were focused on restoring financial stability rather than expanding operations.
Table 5: Key financial indicators for Meituan 2016-2021
Table 6: Key financial indicators for Ele.me (Alibaba) for 2016-2021
Table 7: Key financial indicators for Pinduoduo for 2016-2021
Table 8: Key financial indicators for Dada Nexus for 2016-2021

The fundamental criterion for ROE and ROA is gross profit, which was the highest for Meituan in 2016, after which it has undergone a generally negative trend. The company’s average gross profit growth was minimal among all competitors except for the youngest Dada Nexus. The downward trend in gross profit, leading to lower ROE and ROA in the last three years, was due to the higher cost of goods sold due to higher prices from suppliers, which was due to the negative impact of COVID-19 on supply chains (Yang et al., 2021). In addition, Meituan was forced to pay an antitrust fine and faced a workers’ strike in the last two years, which caused a decrease in net profits (Tobin, 2021). Another factor determining the short-term performance of the Chinese company is the decline in operating profit and adjusted EBITDA; the EBITDA margin is below an attractive level for investment (10%), although the company is expected to reach acceptable levels within the next few years (Meituan, 2021). The loss in EBITDA shown in the last three years seems inconsistent with the Company’s credit profile, which creates concerns about the timing of recovery of this indicator in short-term investments.
Liquidity
Liquidity ratios demonstrate the company’s ability to pay its debt obligations, with values above “1,” indicating that the business is efficient in this regard. Tables 9-11 show that only Pinduoduo had trouble paying its debts during the reporting period, while Dada Nexus had the highest liquidity ratios. Meituan’s liquidity was not at risk between 2016 and 2021, which means that the company is able to repay both short-term and long-term liabilities to creditors. The CR and QR values for Meituan were at moderate levels compared to industry peers, which does not seem surprising given the high leverage for developing organizational projects. Meituan continued to maintain elevated leverage in equity during the reporting period, with total liabilities increasing significantly in the post-pandemic period as the company needed funds to expand operations amid pressure from both healthcare and government.

Table 9: Current Ratio for competitors
Table 10: Current Ratio for competitors
Table 11: Total Liabilities (in CNY) for competitors
R&D
Companies’ financial freedom, including the ability to invest capital in R&D, is reflected through the IRC. Table 12 shows that Meituan is about twice as restricted to using its capital for purposes other than debt repayment than Ele.me. Nevertheless, the IRC values for Meituan are above the cap of 1.5x, which means that the company should not be considered questionable for investment because, when combined with Tables 10-11, this indicates the ability to pay off debts to creditors. The decrease in IRC in 2020 compared to 2019, however, indicates a decrease in Meituan’s financial capital freedom, which again is justified by the company’s declining net income in recent years (Table 4). This leads to the conclusion that Meituan’s main strategy at the moment is to balance the pursuit of expansion and profit in light of increasing regulatory pressure on the market.
Table 12: Interest Coverage Ratio for competitors

Innovation and commitment to technology are often cited as justifications for Meituan’s relatively low profits, indeed areas of strategic development in which the company has invested over the past six years. A reference to Table 13 shows that the share of R&D spending relative to competitors’ total operating expenses has been extremely high for Meituan, but not the maximum. Between 2016 and 2020, Meituan actively increased its share of R&D spending by an average of 3% per year, in contrast, to direct competitor Ele.me, which showed high volatility in this metric. From the above, we can conclude that Meituan sees a successful future in developing technology add-ons to its current business systems and is expanding its R&D presence within the company structure. Given that the company has entered profitability since 2019, this appears to be a prudent strategy for Meituan.
Table 13: R&D expenditures for competitors
Performance
Regarding overall performance, the average ARD for Meituan was the lowest in the reporting period, while the longest debt payment time to business was characteristic of Pinduoduo. The low ARD may indicate Meituan’s reasonable debt policy and good relationships with suppliers. Meituan has created a practice that its customers try to pay their accounts receivable within an average of 7 days. An alternative numerical indicator is DPO (Table 15): Meituan again showed about half as much time to pay accounts payable as Ele.me: we can conclude either that Meituan is not using the full payment period and paying off the debt much faster than required, or that it is using shorter creditor terms. This is not necessarily a good signal, as it could mean that the credit terms for Meituan are worse than those for Ele.me, which reduces the investment appeal of Meituan. Table 18 shows that Meituan’s cash-to-stock ratio is again much lower than Ele.me’s, indicating higher company turnover combined with lower inventory obsolescence risk for Meituan. Based on the three operating efficiency ratios, the Cash Conversion Cycle (Table 17) is negative for major competitors, which is a desirable business strategy; in other words, Meituan and Ele.me suppliers are financing their operations before the companies have to pay for inventory. In this respect, Ele.me performs a more efficient conversion cycle than Meituan because its CCC value is about 1.6 times lower, indicating that Alibaba’s business is more liquid.
Table 14: Accounts Receivable Days for competitors
Table 15: Days Payable Outstanding for competitors
Table 16: Days inventory outstanding for competitors
Table 17: Cash Conversion Cycle for competitors
Capitalization
The main indicator of the company’s profitability, efficiency and investment attractiveness is its market capitalization. Table 18 shows that the market capitalization of Ele.me was the highest for the whole period and tended to grow almost linearly. Against Ele.me, the size of competitor companies, including Meituan, was significantly smaller, and almost all (except Dada Nexus) showed constant growth through 2021, although at different rates. The findings suggest that, in the overall context, Ele.me is a more attractive investment, both in terms of average growth and in terms of underlying value; however, this does not mean that it is not worth investing in Meituan.
Table 18: Market capitalization (in m. CNY) for competitors
Intriguing is the insider sale of a portion of the controlling shares by one of Meituan’s non-executive directors in the summer of 2022. Shen Nan Peng reportedly sold about 6.5 million shares of the Company in late July of this year (The Value Pendulum, 2022). Surprisingly, Peng is Meituan’s private advisor on investment strategies, so the sale of some assets may indicate the Company’s deteriorating investment profile. Probable reasons for this behavior are the brand’s prolonged operating losses combined with growing competition and regulatory risks
Financial Analysis and Forecasts
Meituan’s revenue and profit forecasts through 2026 were based on both pre-calculated expert estimates and an understanding of the dynamics of these indicators over the reporting period (see the Excel file “Meituan Forecast”). The forecast was based on an understanding of the industry’s growth trend: China’s population continues to grow at a declining rate, with digitalization becoming increasingly dense in users’ daily lives. Based on this, the Company is expected to break even after 2022, with a record net income growth of 208 percentage points, but revenues will decline over time (Table 19). The revenue growth boundary projections are perfectly in line with Meituan’s projections, which report that revenue growth over the next five years will be in the range of 3% to 31%. It is also anticipated that competition in the market will continue to grow, resulting in Meituan having to spend more money and borrow more funding to invest in order to become more competitive, even in niche markets. This is reflected, in particular, in the growing share of R&D in the company’s capital: investment in technology, which began in 2018, will continue to grow over the next five years. At the same time, it is fair to note that with the expansion of market niches and the broader assortment in the future, which is already happening now, the company will face logistical problems, which will be reflected in a small increase in DIO; goods will stay longer in the company’s assets, which could probably affect product quality in the absence of adequate operational management. DSO and DPO are not expected to change too much over the forecast period. Notably, sales are projected to increase while Gross Margin decreases — more users are expected to start ordering from Meituan, but due to rising risks, penalties, and logistics complications, the Company will not increase breakeven. Nor should we ignore the fact that technology moguls in China face regulatory risks, so explosive growth in Meituan’s capital should not be expected, even with the continued trend of mergers and acquisitions.
Table 19: Projected assumptions for Meituan
As for Meituan, no forthcoming acquisitions or mergers, or the sale of plant facilities, have been reported. Meituan is expected to continue expansion into new cities and restaurants and will not change the vector of investment in innovation expansion, which will lead to additional logistics risks — but the moderate inelasticity of demand, especially in COVID-19 outbreaks, allows us to be confident of offsetting these risks with strong demand. While companies in the hardest-hit industries will reportedly take five years to recover, O2O food delivery, by contrast, has experienced a boom in that time, so it will be able to recover much more quickly. Nevertheless, the company’s net revenues will decline during this time due to increased competition and regulatory, including geopolitical pressures. In an attempt to maintain operational efficiency, Meituan will increase SG&A margins in equity.
In past years, there have also been periodic issuances of new shares on the Hong Kong Stock Exchange on behalf of Meituan. Table 20 shows that the company issued about 198 million shares of new stock in 2021, which nevertheless had minor impact on the total number of shares outstanding, given the total number of 10 billion shares outstanding annually, unchanged for Meituan. The issuance of new common stock in 2018 and 2021 may indicate a need to raise capital to grow the business lines. In 2018, the reason could be to invest in automated drone technology (Wu, 2019). In 2021, this event could signal the start of post-pandemic recovery processes, which is ideally aligned with expected net income growth as early as 2022 and beyond.
Table 20: Dynamics of the issued shares
Evaluation
On the one hand, Meituan generally weathered the restrictive times of COVID-19 well and did not show a severe drop in revenues; on the contrary, Meituan focused in these years on those areas that brought it long-term profits (Lococo, 2021). Already by 2021, Meituan was able to show an increase in profits as well as an increase in market capitalization due in part to the issuance of 198 million new common shares. These signals, combined with Meituan’s confident propensity to invest in technology and innovative development, may indicate an increase in investment attractiveness. On the other hand, the forecasts show no sharp increase in net income for the Company in future years and show a decline, although Meituan will continue to be profitable over time. Overall, the projections illustrate an exit to some stability for the Chinese brand: growth in profits, sales, and PP&E, while performance metrics remain stable.
A DCF analysis was used to assess the correspondence between intrinsic and market values. Assumptions for the analysis included a discount rate of 9%, which is based on historical Treasury bond maturity rates and risk premiums. Based on the DCF model (Table 21), it is estimated that Meituan’s internal equity will show growth over the next five years, with debt financing continuing to decline. The calculated intrinsic value is CNY 299.9 by the end of the five-year period, giving a percentage growth of 23.7%. It is noteworthy that the calculated RIF (Table 22) present value of intrinsic value coincides with the results of the DCF analysis, indicating the reliability of the forecast.
Table 21: DCF analysis for Meituan
Table 22: RIF analysis for Meituan
The calculated intrinsic value at the end of the five-year period exceeds the current share price by a threshold above 10%. Based on this forecast, we can conclude that the Company will continue to grow, and therefore the current market value can be considered undervalued. Based on this forward-looking assumption, an investment recommendation is to purchase Meituan stock with an expected growth rate in excess of 15% within five years. Combined with the Company’s intention for stable long-term growth and projected net income growth (Table 19), the purchase of shares should be considered a viable private investment strategy.
Conclusion and Recommendation
Meituan’s non-voting shares have been traded on the Hong Kong Stock Exchange since 2010 when the company went public. At the time of this dissertation, the value per share was 119.04 CNY (as of 2021) and was determined to be undervalued based on DCF and RIF analysis. The Company’s intrinsic value is expected to show a 23% increase over the five-year period. The Company has suffered losses in recent years, and while it came out with modest net income in 2019-2020, the post-pandemic period, based on adjusted projections, shows losses for at least three more years. Meanwhile, starting in 2022, profit growth is projected, driven not only by the widespread adoption of digital technology in consumers’ daily lives but also by the company’s commitment to innovation. Specific organizational reasons for Meituan’s growth should include a focus on business expansion and a conscious rejection of short-term profitability. To evaluate the conclusions, a comparison of P/E and QRC YOY was used (Table 23): the results show that Meituan appears to be the most attractive investment among competitors, even in the context of Ele.me showing high stability in recent years.
Table 23: Forecast P/E and QRG YOY values for competitors
However, it is fair to admit that the forecasts may be inaccurate because of the assumptions made for the DCF and RIF analyses. The main assumptions of the DCF are FCFF forecasts that do not consider geopolitical and regulatory risks to the company. In the event of increased pressure on technology firms in China, it is likely that Meituan would be unable to demonstrate the expected breakeven, in which case the company’s stock would be overvalued. In an effort to preserve the business, Meituan is actively investing and will continue to increase the size of these R&D investments, which negatively affects margins – the target price may be lowered as a consequence. In addition, the models’ assumptions are a strong focus on the Company’s short-term and long-term debt, while it has been determined that Meituan has been pursuing a deleveraging policy for several years, which was not reflected in the forecast. Against the constraint, Meituan’s recently released 2022 quarterly report indicates an increase in earnings and EBIT compared to the first quarter of 2021, at the same time as an increase in R&D spending. Meituan’s stock price, in addition, shows a 33% increase over the last five months, which also gives a chance for further growth.
Bibliography
Acquired. (2021). The complete history and strategy of Meituan. Acquired. Web.
Blazyte, A. (2022). Number of online food delivery merchants in China 2017-2019, by platform. Statista. Web.
Brown, T. (2022). Meituan looks to expand its e-commerce business. It wants to rival Alibaba and JD.com. Barrons. Web.
Bu, L., Chung, V., Leung, N., Wang, K. W., Xia, B., & Xia, C. (2021). The future of digital innovation in China [PDF document]. Web.
Cao, A. (2022). Alibaba shed nearly 10,000 employees in June quarter as the e-commerce giant cuts costs amid sluggish sales, slowing economy. SCMP. Web.
China Ecommerce. (2022). 12 China E commerce market trends 2022. Tenba Group. Web.
Cissy. (2017). Ele.me, digitizing the food delivery service in China. DI EDU. Web.
CIW. (2022). Meituan revenues up 31% in Q4 2021, reaching 691 million paying users. Chine Internet Watch. Web.
CRS. (2022). China’s economy: Current trends and issues [PDF document]. Web.
Dada Nexus Limited. (2020). 20,000,000 American depositary shares [PDF document]. Web.
Dada Nexus Limited. (2021). Dada announces unaudited fourth quarter and fiscal year 2020 financial results. GN. Web.
DC. (2022). China’s duopoly food delivery market. Daxue Consulting. Web.
Deng, I., & He, L. (2019). Meituan willing to sacrifice profitability for growth as business model shifts from subsidies to investments. SCMP. Web.
ELLUMINATI. (2022). How does Meituan work? Embrace Meituan Clone and serve online. ELLUMINATI. Web.
Finbox. (2022). Meituan. FinBox. Web.
Han, S., & Law, J. (2018). Infographic: A closer look at China’s online food delivery market. US-China Today. Web.
IBIS. (2022). Online shopping in China industry trends. IBIS World. Web.
Jun, T. D. (2020). Meituan Dianping: The undisputed king of China’s 45-billion-dollar online food delivery industry. FSM. Web.
Lee, E. (2018). The incredible rise of Pinduoduo, China’s newest force in e-commerce. TechCrunch. Web.
Lee, E. (2021a). Meituan fined $534 million for antitrust violations. TechNode. Web.
Lee, E. (2021b). Meituan faces data privacy controversies after antitrust fine. TechNode. Web.
Lingling, L. (2022). China’s takeaway industry development status, market competition pattern and future development trend analysis in 2021: Meituan takeaway market share continues to rise. Chyxx. Web.
Liu, C., Huang, Z., & Zheng, S. (2022). China’s tech giants lost their swagger and may never get it back. Bloomberg. Web.
Lococo, E. (2021). Meituan Announces Financial Results for the Three and Six Months Ended June 30, 2021. CISION. Web.
Luo, H. (2021). Food delivery industry in China [part 2]: From algorithms to sustainability. Seneca ESG. Web.
McKinsey & Company. (2020). COVID-19 recovery in hardest-hit sectors could take more than 5 years. McKinsey & Company. Web.
Meituan. (2018a). Meituan acquires Mobike, one of the world’s largest bike-sharing companies. Meituan. Web.
Meituan. (2018b). Annual report [PDF document]. Web.
Meituan. (2019a). Meituan to showcase autonomous delivery technologies at CES 2019. Meituan. Web.
Meituan. (2019b). Annual report [PDF document]. Web.
Meituan. (2020). Annual report [PDF document]. Web.
Meituan. (2021). Annual report [PDF document]. Web.
Meituan. (2022). About Meituan. Meituan. Web.
MERGR. (2015). Meituan acquires Dianping. MERGR. Web.
Ozili, P. K. (2022). Global economic consequence of Russian invasion of Ukraine [PDF document]. Web.
Singh, G. (2019). China-US trade war: An overview. Management and Economics Research Journal, 5(S4), 1-7. Web.
Smith. G. (2022). Ele.me statistics, user counts, facts & news (2022). DMR. Web.
SRD. (2022). Online food delivery. Statista. Web.
Textor, C. (2022). Population in China in 2020, by region. Statista. Web.
The Value Pendulum. (2022). Meituan: Insider selling draws attention. Seeking Alpha. Web.
Thomala, L. L. (2021). Number of social media users in China 2017-2026. Statista. Web.
Tobin, M. (2021). How China’s food delivery apps push gig workers to strike. Rest of World. Web.
UNCTAD. (2021). Global e-commerce jumps to $26.7 trillion; COVID-19 boosts online sales. UN Conference on Trade and Development. Web.
Viktor. (2018). The Pinduoduo business model – how does Pinduoduo make money? ProductMint. Web.
WBG. (2021). China economic update – December 2021 [PDF document]. Web.
Wordometer. (2022). China population. Wordometer. Web.
WPR. (2022). Most technologically advanced countries 2022. World Population Review. Web.
Wu, Y. (2019). Meituan Dianping introduction. YouTube. Web.
Yang, F. X., Li, X., Lau, V. M. C., & Zhu, V. Z. (2021). To survive or to thrive? China’s luxury hotel restaurants entering O2O food delivery platforms amid the COVID-19 crisis. International Journal of Hospitality Management, 94, 1-7. Web.
Zhou, Q. (2022). China’s most productive provinces and cities as per 2021 GDP statistics. China Briefing. Web.
中商产业研究院. (2022). 2022年中国外卖行业发展现状及发展前景预测分析(图). AskCI. Web.
干货收割机. (2021). 外卖行业数据分析:2021年中国35.2%消费者月均点外卖1-5次. MdEditor. Web.