Introduction
Unemployment may be defined as the state of not having a job. An example of an unemployment rate is when a specific number of individuals in America seek a job but are unable to find it. This percentage is referred to as the unemployment rate. On the other hand, unemployment occurs when you are dismissed from your job and do not have a new one. Inflation is defined by a decline in buying power (money), reflected by a rise in the economy’s cost of goods and services.
When the unemployment rate rises, the ratio of bargaining between a corporation and an employee shifts in favor of the latter; firms acquire the capacity to employ employees at lower salaries merely because many jobless individuals are desperate for work. Workers are ready to accept lesser wages because they understand that if they do not, somebody else will. Whenever the wages to be paid fall, corporations find it in their best interests to manufacture more commodities to maximize profits. Many items are only be sold at a lower per-unit price. The general price level falls when this effect is multiplied across the economy. A drop in the end-year price level for the beginning price level results in lower inflation than what would have occurred if the unemployment rate had not declined. As a result, an increase in the unemployment rate often cuts inflation.
The connection between economic growth (GDP) and unemployment demonstrates a strong correlation between the pace of economic growth and the rate of decline in unemployment. A high growth rate reduces the unemployment rate. According to Okun’s law and financial literature, the change in GDP and the difference in the unemployment rate have an inversely proportional connection. This suggests that a decrease in the unemployment rate would be caused by increased GDP growth with a low inflation rate.
High-tech businesses constitute an essential element of the U.S. economy, employing millions. While this accounted for around 12% of overall employment, the high-tech industry provided nearly 23% production (Terrell, n.d.). It is critical to investigate and address the unemployment rate among employees with less than a high school diploma and in the high-tech industry as technology advances and companies and industries show little interest in recruiting people with less than a high school diploma. There will be fewer manufacturers and enterprises to supply work for if the population of people with less than a high school certificate grows.
Data
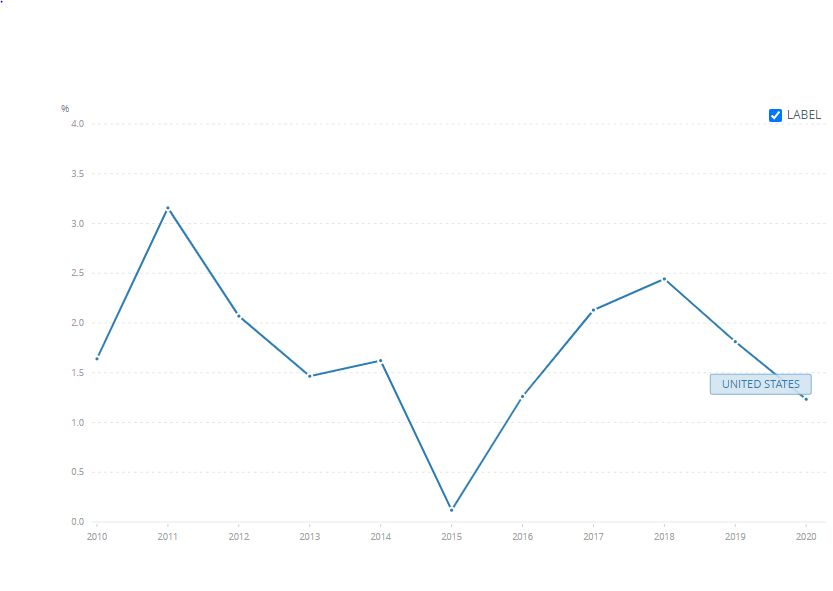
Table 1. GDP growth (annual %) GDP growth rate between 2010 and 2020. Source: (GDP Growth (Annual %) – United States | Data, n.d.)

The graph depicts the percentage change in GDP in the United States from 2010 to 2020 compared to previous years. According to the chart, higher levels of economic growth are connected with lower rates of unemployment growth (GDP Growth (Annual %) – United States | Data, n.d.) In contrast, if GDP growth exceeds its natural pace, policymakers will opt not to aggressively push job creation to achieve a sustainable growth rate that does not cause inflation. There was a significant decline in GDP in 2019 by -5.65%, signifying an increased unemployment rate.
Table 2. Source: (Inflation, consumer prices (annual %) – the United States | Data. n.d.).
The graph shows an inverse correlation between inflation and unemployment. As the rate of unemployment declines, the pace of inflation rises.

The graph shows a decline in the unemployment rate between 2010 – 2020, after which there was a rise in unemployment.
Table 3. Source: (U.S. Bureau of Labor Statistics, 2021)
Table 4. Source: (U.S. Bureau of Labor Statistics, 2021)


Analysis
The unemployment and inflation in the United States from 2010 through 2020 fluctuate when the economy enters and exits recessions. However, the unemployment rate appears to be returning from 3% to 6% over time. There is no long-term pattern in which the rate moves typically higher or generally lower (FRED Graph, n.d.). From 2010 through 2020, unemployment and inflation rates were relatively low by recent standards. The unemployment rate was less than 5% from 2016 to 2020, and it was 3.5 percent in the first quarter of 2020.
Some of the primary variables influencing the rate of unemployment among employees with less than a high school diploma and in high-tech sectors are education and population. An increase in job searchers with less than a high school diploma will increase the unemployment rate. Graduates with a high school diploma, on the other hand, are more likely to be hired as skilled or semi-skilled employees in high-tech firms (Axelrad et al., 2018). These issues represent a significant challenge to GDP growth due to their inverse relation to inflation, unemployment, and GDP.
As machines replace manual labor, the demand for physical delivery in high-tech businesses has been reduced. When computers are utilized, just one person is recruited who maintains computer skills, and that single individual handles all work connected to software and finances. Manual labor takes more than a single person to keep records, calculate profit and loss, and increase employment.
Reflection and Critical Thinking
During a recession, the unemployment rate tends to grow fast and typically remains high. With the advent of a recession, firms begin to lay off people to cut expenses as they confront higher costs and stagnant or declining income. Education and skill level improvement are positively related to a country’s GDP. The human resource paradigm holds that the number of years invested in the educational system enhances one’s opportunity to find work. Many qualified and educated job searchers are critical to filling job opportunities in high-tech companies. As long as low levels of unemployment are reported, GDP will grow significantly, and inflation will rise.
Solution
The GDP growth shows that the economy grows from quarter to quarter, and unemployment rates are often low. This is because increasing (absolute) GDP levels indicate that output is rising, so more employees must keep up with the increased production levels. The economy is mainly examined through the lens of economic income, unemployment, and inflation. Although consumers ultimately determine the economy’s course, governments may affect its monetary policy.
Monetary policy is implemented as a solution. With a short supply of cash, the central bank injects money into the local economy. As a result of the rising demand for bonds, interest rates are cut, and to keep up with growing output, should reduce unemployment and earnings should rise. An increase in interest rates, on the other hand, will eventually result in lower inflation and lower actual production.
References
Axelrad, H., Malul, M., & Luski, I. (2018). Unemployment among younger and older individuals: does conventional data about unemployment tell us the whole story? Journal for Labour Market Research, 52(1).
FRED graph | FRED | st. Louis fed. (n.d.). Fred.stlouisfed.org.
GDP growth (annual %) – United States | Data. (n.d.). Data.worldbank.org.
Inflation, consumer prices (annual %) – United States | Data. (n.d.). Data.worldbank.org.
Terrell, M. W. and D. (n.d.). The high-tech industry, what is it and why it matters to our economic future: Beyond the Numbers: U.S. Bureau of Labor Statistics. Www.bls.gov.
U.S. Bureau of Labor Statistics. (2021). U.S. Bureau of Labor Statistics. Bls.gov.
Unemployment Rate by Educational Level. (n.d.). Www.macrotrends.net.
Weekly Economic Index (WEI). (n.d.). Www.newyorkfed.org.